Once you eliminate the noise around the politics of a weak economy and look at the facts, it appears the U.S. tire market is ready to break records.
The U.S. replacement tire business (which is greater than 80% of industry volume) is facing demand never before seen in the truck and bus radial (TBR) segment. Additionally, the consumer segment is about 1% below prior peak levels. This year, the tire industry is on pace to ship approximately 240 million consumer replacement units, but only if volume grows a modest 2% in the second half of the year. This is a feat that hasn’t been accomplished since 2005.
Variables on our checklist that could work in favor of the industry include the following:
1) Positive U.S. gross domestic product and unit sales at the retail level;
2) Billions of dollars in new capacity investment from global tire manufacturers through the end of the decade;
3) Miles driven growth for several years in a row correlated to improved employment levels;
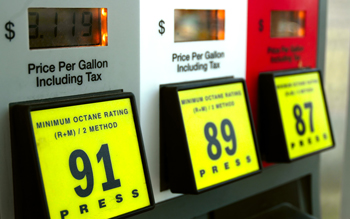
4) Persistently low gas prices, and
5) Record vehicle age for the U.S. car parc (or number of vehicles in a region).
This confluence of positive factors leaves us with a constructive bias toward industry demand remaining at or above prior peak levels over the next several years.
On the consumer replacement side, our survey data of U.S. retail chains indicates unit sell-out was up 2.7% year-over-year (YoY) on average during the past 12 months. Additionally, our survey data shows a revenue increase on the service side of 4% YoY during the past 12 months.
More importantly, we have seen a fair amount of price stability in the end market. Through the first half of 2016, all signs point to a disciplined environment, consistent with what we’ve seen the past several years. Overall, fundamentals of the U.S. market have been solid for manufacturers as well as for tire retailers which we expect to continue over the next couple of years.
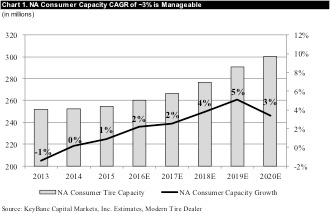
The favorable industry backdrop has given tire manufacturers enough confidence to green light major capacity expansions, which we do not view as a major near-term threat to industry revenue/tire as the extra supply is coming online to satisfy higher end demand. Based on our analysis of new capacity coming online in North America (NA), there will be as much as 3% total consumer capacity annual growth rate through 2020.
The industry structure appears favorable whereas manufacturers will adjust capacity to match demand rather than to aggressively chase demand. New capacity is primarily for high-value-added (HVA) tires, where volume growth is forecasted up mid-single digit over the next several years. New HVA capacity is needed as several leading manufacturers in North America have been constrained for HVA capacity the past couple of years and importing tires. In fact, Goodyear’s HVA backorders in North America have been increasing, according to company commentary.
HVA tires are positive for price/mix (i.e., more revenue per tire) and saturation fears regarding profitability degradation might prove to be overdone as the majority of shipments are already HVA, and as a greater mix shift already occurred. For example, Goodyear forecasts HVA shipment mix will increase to 74% of Americas region by 2019 vs. 65% in 2015 (2% increase annually). We believe part of recent manufacturer price discipline is related to a large HVA mix improvement of 300bps annually from 2012-2015 (53% in 2012 to 65% in 2015).
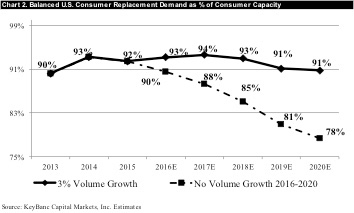
We ran data to compare U.S. consumer replacement demand to North American consumer capacity forecasts and concluded the industry needs modest growth to maintain a favorable supply/demand balance through 2020. The analysis in Chart 2 is somewhat conservative because it assumes all new capacity is for U.S. replacement only. However, much of the capacity will be designated for the original equipment channel (20% of mix) as well as replacement markets outside the U.S.
When assuming a GDP-like 3% CAGR in U.S. consumer replacement from 2016-2020, surprisingly, we found that the ratio of demand vs. capacity improves 100bps annually in 2016 and 2017. During the 2018-2020 periods, the analysis predicts a low 90% utilization rate. We expect this supply/demand relationship to support pricing stability over the next 12-18 months, particularly since new capacity has certain internal rate of return requirements, which needs a degree of discipline.
Manufacturers are clearly focused on generating every gross profit dollar possible on their inventory and the supply constraints contribute to the lack of negative price realignment in the near to mid-term. While our analysis predicts a fairly stable supply/demand balance, some of the channel feedback we get is indicative of new supply in the U.S. market exceeding sell out forecasts, which is an element of risk on the pricing equation that could take place during 2018-2020.
We get the sense that production coming online is slated for higher speed-rated products focused on the high end, which will correlate well to the car parc that has been introduced in the past 3-5 years. As a result, we continue to have a positive bias on price/mix over the next several years. (Editor’s note: “Car parc” is a term often used by industry analysts and refers to the number of vehicles in a region or market, often used to gauge the likelihood and capacity of aftermarket activity.)
The potential [TBR] tariff could be a significant market share positive for manufacturers with localized capacity (such as Goodyear) as China TBR imports into the U.S represent 50% of replacement demand annually.
We also ran an analysis that assumes no volume growth over the next several years. Under this scenario, there appears to be an imbalanced supply/demand scenario, which isn’t very surprising. As a result, U.S. volume growth above and beyond prior peak levels is a key tenet of our positive industry view.
An analysis of 10 of the largest tire manufacturer’s capital expenditure budgets to spot potential anomalies, to see if the industry is overinvested, reads neutral to us. Industry capital expenditures will be up 2% over the next two years, which compares to a 3% decline in the past three years. Capital expenditures as a percentage of sales are expected to be stable in the 7.5-8.0% range over the next few years.
Therefore, we believe peak manufacturing profit margins are potentially sustainable, assuming raw material costs do not materially inflect higher. Supply/demand imbalance risk seems to not be a long-term issue as we took notice of recent outlooks, including:
Michelin
(#2 share globally)
Groupe Michelin recently indicated 2016-2020 earnings-before-interest-and-taxes (EBIT) margin guidance for the light vehicle tire segment increased to 11-15% from the prior 10-12% target. Actual
performance was 11.5% in 2015 and 10.5% in 2014.
Goodyear
(#3 share globally)
Goodyear Tire & Rubber Co. doesn’t see supply catching up with demand for the rest of the decade. Therefore, margins in NA have potential to move higher.
Continental AG expects EBIT growth in the tire business over the next several years. Growth forecasts are driven primarily by favorable mix (consistent with our earlier HVA commentary).
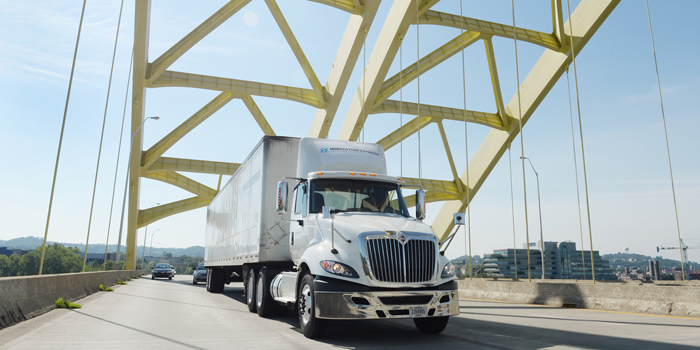
Lastly, on the TBR replacement side, our data indicates the end market is healthy growing in mid-single digit territory at retail, but a potential tariff on Chinese TBR imports could cause some volatility and uncertainty.
We believe this potential tariff could be a significant market share positive for manufacturers with localized capacity (such as Goodyear) as China TBR imports into the U.S represent 50% of replacement demand annually (vs. 20% in the consumer segment before last year’s consumer tariff). Domestic TBR manufacturers are likely to benefit from share gains and stable pricing.
Tariffs can typically drive low-end tire pricing higher by double digits, which has favorable implications for manufacturers in all tiers.
Overall, we remain optimistic the U.S. industry replacement volumes will stay at or above prior peak levels, with favorable industry fundamentals to support your game plan.