By Dr. Timothy Nash and Dr. Keith Pretty
The latest revision of first quarter 2015 U.S. GDP was revised upward to 0.6% with the first estimate of second quarter U.S. GDP reported at 2.3% growth as of July 31.
Early estimates predicted that GDP would improve to perhaps as high as 2.4% growth in the second quarter based on the Atlanta Federal Reserve Banks GDPNOW forecasting tool. It is important to note that since the GDP came in at 2.3% in the second quarter, average GDP now stands at a disappointing 1.45% growth rate for the first half of 2015, well below the 3.2% average annual growth rate for the U.S. economy since the end of The Great Depression.
In fact, U.S. GDP growth has averaged a dismal 1.8% since the beginning of 2009, the worst seven-year period since the end of World War II. At the time of the writing of this article, the Dow Jones Industrial Average closed at 17,568 down more than 1.5% since its Dec. 31, 2014 close. [Editor’s Note: The Dow closed at 16,624 on Sept. 9.]
The U.S. economy continues to try to find clear-cut direction, it’s true north. Mixed signals are abound as much of “your” perspective depends on where you live and/or for whom you work. Bankers are generally optimistic as a result of historically low interest rates that are the direct result of Federal Reserve monetary policy and quantitative easing. The result: the cost of financing a new automobile, a new home or refinancing an existing home are at or near all-time low interest rates.
The aforementioned has helped to make up for poor income growth and below average GDP growth over the last four years. U.S. new automobile, light truck and SUV sales continue on a pace to surpass 2014 levels, with sales at the end of June more than 350,000 vehicles sold ahead of the midway point in 2014.
Retail sales continue to lag as does consumer spending for the first half of 2015, while real estate and general manufacturing show erratic patterns and no clear direction thus far in 2015.
To get a better handle on current and future direction of the U.S. economy, we will briefly examine global GDP growth, global corporate income tax rates, average annual price of oil, average U.S. national debt, U.S. average household income growth, and finally the relationship between government, households, and business.
Components of the Forecast
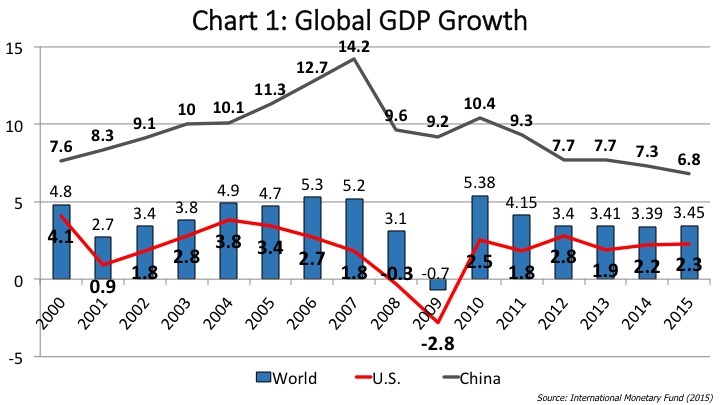
The U.S. economy has grown at a slower pace than the global average and certainly slower than China since 2000. The U.S. economy has grown at an average rate of 3.2% since the end of World War II, yet is only growing at roughly 2% since the U.S. economy began its Great Recession recovery in 2010. Many experts believe that an enhanced regulatory and tax burden over the last decade is responsible for slowing growth in the U.S. relative to the rest of the world (see Chart 1).
Perhaps the most important debate that must take place in Washington, D.C., in 2015 is the one surrounding the U.S. competitiveness and tax reform. The U.S. remains the largest and most competitive economy in the world, but as depicted in Chart 1 is at a tremendous tax disadvantage relative to the rest of the world.
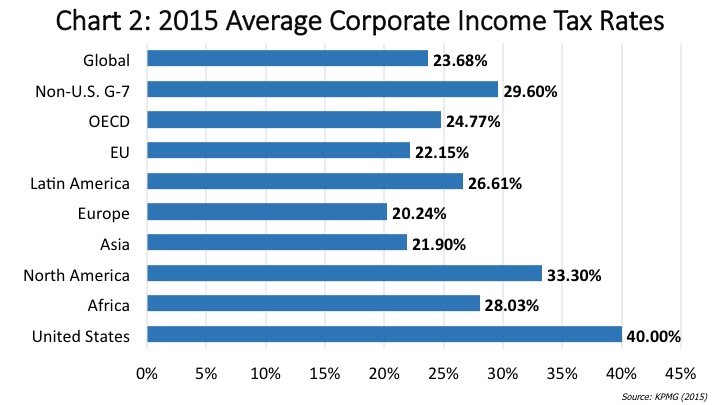
Based on the data provided by KPMG, one of the world’s foremost international tax firms, U.S. businesses are at a competitive income tax disadvantage by region, globally, and certainly as a country. According to KPMG, the U.S. at 40% has the highest average income tax rate in the industrialized world. Pro-business tax reform in the U.S. is a must, if American businesses are to compete, thrive, and grow in the ever-complex global economy of the future.
In addition, the Patient Protection and Affordable Care Act (ACA) continues to be debated for its efficiency and effectiveness. What many Americans do not realize is that there were numerous tax increases outlined in the act to pay for its implementation. The top Medicare tax rate went from 1.45% in 2013 to 2.35% in 2014.
The top personal income tax bracket went from 35% to 39.6% as a result of the law, with top income payroll tax rates, capital gains tax rates, dividend tax rates and estate tax rates all increasing dramatically as a result of the passage of the ACA (see Chart 2).
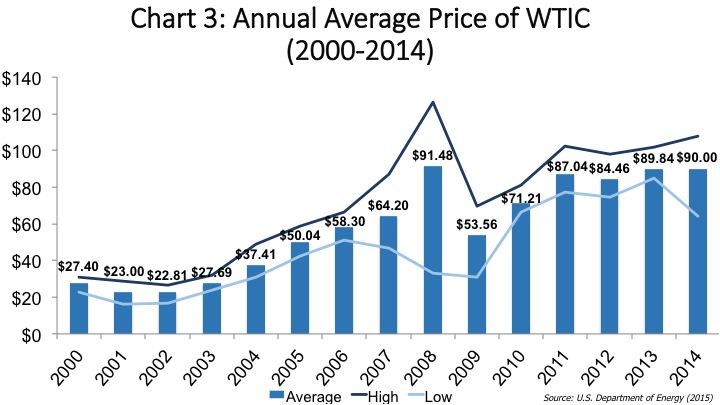
Global oil prices as measured by West Texas Intermediate Crude (WTIC) averaged well under $20 a barrel during the 1990s. Increased global demand, inflation and military conflicts drove oil above $140 a barrel in 2008. A slowing global economy, enhanced fuel efficiencies and the use of new technologies, such as wind, solar and especially hydraulic fracturing have increased the supply of electricity, oil and natural gas, particularly in the U.S.
With WTIC below $50 a barrel in July 2015, long-run lower oil prices – if sustainable – should bode well for the U.S. motor vehicle aftermarket and the roughly 258 million automobiles, light trucks and SUVs it serves (see Chart 3).
The Impact of Debt
Another major issue presenting problems for the U.S. is our growing national debt. The U.S. national debt stands at roughly $18.6 trillion as of the end of July 2015. From 1776 to 1982 the total U.S. national debt stood at just under $1 trillion dollars, but has increased 18 fold in just under 33 years.
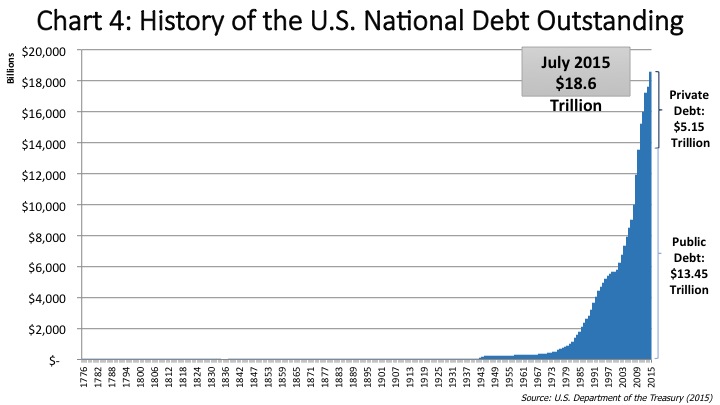
Our current national debt is roughly 103% of the last twelve months of U.S. GDP. Roughly one-third of the total U.S. national debt is owned by foreign countries, with China owning $1.3 trillion and Japan owning $1.2 trillion.
It is estimated that nearly $430 billion dollars will be spent simply paying interest on the U.S. national debt in 2015. According to the Government Accountability Office (GAO), if growth in government spending and government deficits continue at their current pace, the U.S. government will only be able to fund social security, Medicare, Medicaid and interest on the national debt by 2030. If GAO assumptions are correct, we will have no revenue to pay for road building and maintenance, national defense, education, NASA, etc.
It is clear the U.S. has a spending problem that must be addressed or we are only decades away from facing the financial problems that burden many European economies (see Chart 4).
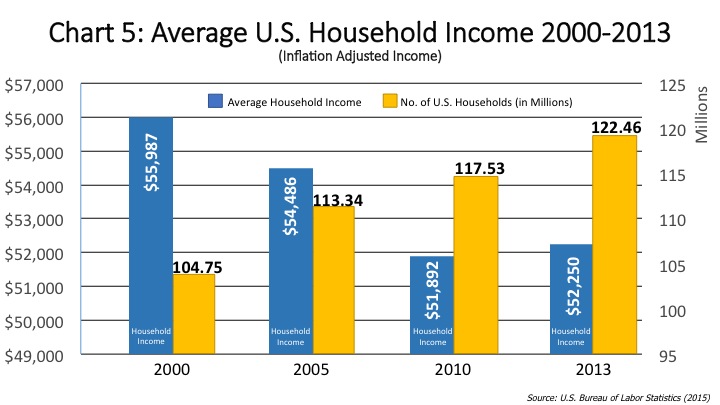
Average U.S. household income adjusted for inflation is lower today than it was in 2000 and 2005 and barely above 2010 levels, based on most recent data from the U.S. Bureau of Labor Statistics. Declining household incomes, the lowest labor force participation rate since the late 1970s and the low pace of quality job creation have left American households with a declining or flat standard of living over the last decade (see Chart 5).
Conclusion
We believe the U.S. economy will grow at an annualized rate of between 2.0%-2.3% for 2015 and between 2.0%-2.2% in 2016. Low interest rates and declining oil prices will be keys for continued U.S. growth in 2016.
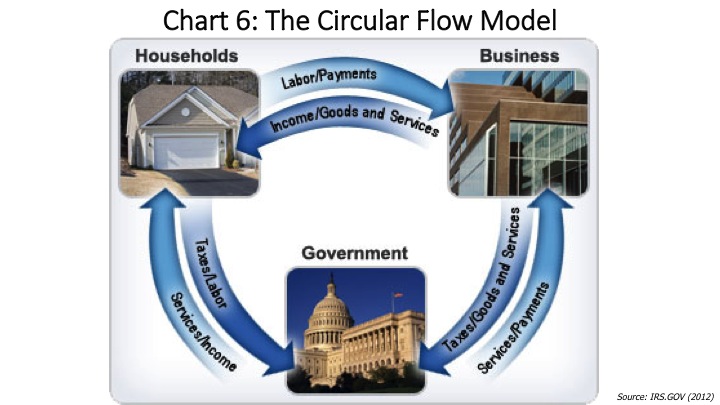
It is our opinion that bipartisan cooperation must return to Washington, D.C., and pro-business, corporate tax reform and government spending constraints must be adopted in 2016 if the U.S. is to return to its average growth rates of 3.2% or higher in subsequent years (see Chart 6).