Commercial truck tires continue to be the No. 1 maintenance cost behind fuel for trucking fleets. Tires can make or break a company. Spec’ing new tires on all 18-wheel positions for a typical linehaul tractor-trailer can easily cost a fleet $7,000 or more. Even when retreads are run on drive and trailer positions, the costs are still significant.
Most fleets measure success of their tire program by tracking cost/mile and miles/32-inch. Initial tire cost is not as important as actual miles/32-inch. Tire A may have a 10% price premium over Tire B, but if Tire A averages 20% higher treadwear measured by miles/32-inch then Tire A is the clear choice.
Since tires have such a large impact on vehicle fuel economy, average miles/gallon is also tracked and linked to tire performance. Fleets rely on their commercial tire dealer to recommend the best new tire and retread for the various wheel positions, but also to help track tire performance data.
Fleets all have the same goal of maximizing tire removal miles, maximizing the number of retreads/casings and, of course, obtaining the best possible vehicle fuel economy. Every tire and tread stock manufacturer produces lines of “fuel-efficient” new tires and retreads for all wheel positions. Improving fuel economy even 1% or 2% has an enormous impact on a fleet’s bottom line. Even if the data shows tire removal miles is down slightly when using fuel-efficient tires, the fuel payback may be so significant that fleet’s are not too concerned about any loss in mileage.
Recommending a Tire
Since no two fleets are exactly the same, it can be difficult for dealers to recommend the best tire for a specific wheel position in a specific service vocation. This is where real-world tire testing comes into play.
Choosing the appropriate sample size for an evaluation is very important. To get useful, projectable test data, the Technology & Maintenance Council of the American Trucking Associations recommends a minimum sample size of 30.
After tracking tire performance for one or two years, it is crucial that the data be statistically valid. There are many variables when it comes to tracking tire performance, including vehicle make/model, route, load, speed, and the greatest variable: the driver. The driver alone can affect tire wear by as much as 35%. An aggressive driver can make a good tire look bad. This is one of the reasons why the test sample size needs to be large enough to be meaningful and statistically valid.
The key to running any tire evaluation is to record the appropriate data every time a tire “event” occurs. Installing the tires on a specific vehicle and wheel position is an “event.” If the tire is punctured and losing air and comes out of service to be repaired, then we have another “event.” If a tire is taken off the steer and run out on a trailer, then we have another “event.” Retreading the casing would also be an “event.”
Each of these events requires a current odometer reading at that point in time so that mileage can be tracked. If the tire evaluation is determining casing retreadability, then total casing mileages will also need to tracked. Tracking tire brands is an excellent idea when you are testing tires to eliminate confusion.
Gathering the Data
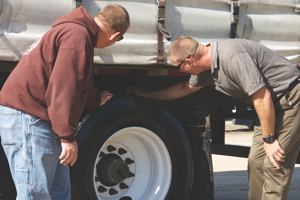
Inspecting the tires that are part of the evaluation on regular intervals is necessary since tires tend to disappear. Vehicles are traveling all over the country and punctures/damages can occur at any time. You can always go back to the most recent tire inspection data if required.
Tire inspection data that needs to be recorded include date, vehicle ID, odometer, wheel position, tread depth across the major grooves, pressure and wear conditions. Irregular wear is usually linked to running tires over- or underinflated, vehicle misalignment or mismatched duals. When tires are not running smooth, fuel economy suffers. Irregular wear conditions such as shoulder cupping always lead to an increase in rolling resistance, which adversely affects vehicle fuel economy. Some tires are more sensitive to developing irregular wear. This is why you test.
Analyzing Hard Facts
Once data is collected and entered into a database is when the data analysis can begin. Your analysis will determine what tire is getting the best performance based on customer parameters. One tire make/model may be best on those long haul routes on a specific vehicle model but possibly a second tire make/model may have higher treadwear on a different vehicle model.
Some tires tend to run just a little cooler because of a combination of tread design and compound. Those tires may have a higher degree of retreadability versus a different tire model. The bottom line is you just never know on how a tire is going to perform at your fleet unless you do a serious evaluation.
Tracking the impact of tires on vehicle fuel economy can be quite complicating. SAE International publishes several fuel economy tests that fleets can run. Fuel tanks must be weighed and the various tire makes/models are mounted on the same vehicle for the evaluation. Many fleets simply keep track of the total fuel used by a given vehicle over time. Vehicle miles divided by the total fuel consumed will result in miles/gallon.
When tires are individually branded and retreaded, sometimes as many as three times, the total casing mileages can be calculated. This is where a fleet can determine a total cost/mile including retreads. A true cost/mile also includes those tire related roadside service calls. Costs can escalate in a hurry when a fleet has to purchase a tire and/or wheel on the road. Reducing tire related roadside calls goes a long way in lowering costs. Many larger fleets dedicate X number of vehicles for continuous tire testing. With all the new tire models being introduced into the marketplace every year, it is in the fleet’s best interest to keep close tabs because there is always room to improve performance and reduce costs in the process.
It is not necessary to track tires from birth to death of multiple retreads for every tire in your fleet. It is too time consuming and costly to enter all the data that would be generated. If you can do a good job of tracking tire performance on 30 or so vehicles then you will learn everything that is required to make good, solid business decisions about your tire performance.
Fleets appreciate the efforts from their local commercial dealers to check tire pressures, recommend tires, help track and record tire data and work jointly to design a tire program that will most efficient and reduce costs.
Working together is a win-win for everyone and will insure a long-term business relationship.